Boston Landfill
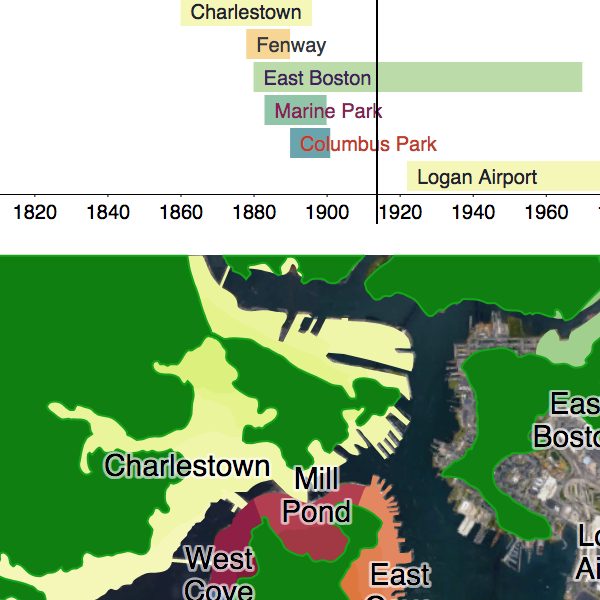
This is a project I became interested in a long time ago. I have been in Boston for over 12 years, and knew that Boston was built over time from a series of landfill projects. I was interested in creating an app that allowed a user to scrub through time and see what parts of Boston were changed and when.
After a little bit of digging, I found this dataset here, an extremely poor quality GIF. I probably could have emailed the professor for something of higher quality, but since I am always up for a challenge, I wanted to use this to practice a variety of skills:
Original data was sourced here, a GIF image: http://www.bc.edu/bc_org/avp/cas/fnart/fa267/sequence.html

A colored GIF is just a F x M x N x C tensor, where F is the number of frames, M and N are the height and width, and C=3 are the 3 RGB channels.
Easy to read image (and make Greyscale):
from skimage.io import imread
from skimage.color import rgb2gray

image = rgb2gray(imread('img.gif'))from skimage.transform import resize as resize_image
image = resize_image(image, (1000, 1000))from skimage.filters import gaussian
image = gaussian(image, 2)I used threshold_minimum which is described as: The histogram of the input image is computed and smoothed until there are only two maxima. Then the minimum in between is the threshold value.
It is described in more detail here
threshold = threshold_minimum(rimage)

binary = (image > threshold).astype(int)
  # binary = binary_dilation(binary)

  return binary
from skimage.morphology import binary_dilation, binary_erosion

image = binary_dilation(image)This creates contours where image = 0. Since we created a binary image with thresholding, this is easy.
from skimage import measure

contours = measure.find_contours(image, 0)from shapely.geometry import Polygon
polygon = Polygon(c)p = polygon.simplify(0.5, preserve_topology=True)In order to convert Shapely shapes to SVG, I manually built my own SVG path elements, similar to this:
path = svgwrite.path.Path()
ext_points = list(shape.exterior.coords)

P = [['M', int(ext_points[0][1]), int(ext_points[0][0])]] + [['L', int(x[1]), int(x[0])] for x in ext_points[1:]] + [['Z']]
[path.push(*x) for x in P]

for interior in shape.interiors:
    int_points = list(interior.coords)

    P = [['M', int(int_points[0][1]), int(int_points[0][0])]] + [['L', int(x[1]), int(x[0])] for x in int_points[1:]] + [['Z']]
[path.push(*x) for x in P]In order to convert Shapely shapes to SVG, I manually built my own SVG path elements, similar to this:
from shapely.geometry import Polygon, MultiPolygon
from xml.dom import minidom, Node
from svg.path import parse_path as parse_svg_path

svg_doc = minidom.parse("data/svg_out.svg")

def parse_path(path):
    points = map(lambda x: (x.start.real, x.start.imag), parse_svg_path(path.getAttribute('d')))
    return points

points = parse_path(svg_doc.getElementsByTagName("path")[0])
Polygon(points)from shapely.geometry import mapping
import json
out = {
"type": "FeatureCollection",
"features": [
{
"type": "Feature",
"properties": { "layer": 5, "region": "logan_airport" },
"geometry": mapping(shape)
}
]
}
json.dump(out, open('test.geojson', 'w'))